
One of the greatest strengths of intelligence analysis is the ability to transform thousands of individual pieces of information into a picture that decision-makers can immediately understand.
While written intelligence reports explain findings, network charts reveal them visually. They enable investigators to see how people, businesses, properties, vehicles, telephone numbers, bank accounts and more are connected, often exposing relationships that would be difficult to recognise from narrative reports alone.
Whether investigating organised crime, fraud, insider threats, money laundering or corporate due diligence, network charts are one of the most valuable intelligence products an analyst can produce.
What is a network chart?
A network chart is a graphical representation of relationships between entities. Each entity is represented as a node, while the relationships between them are represented as links.
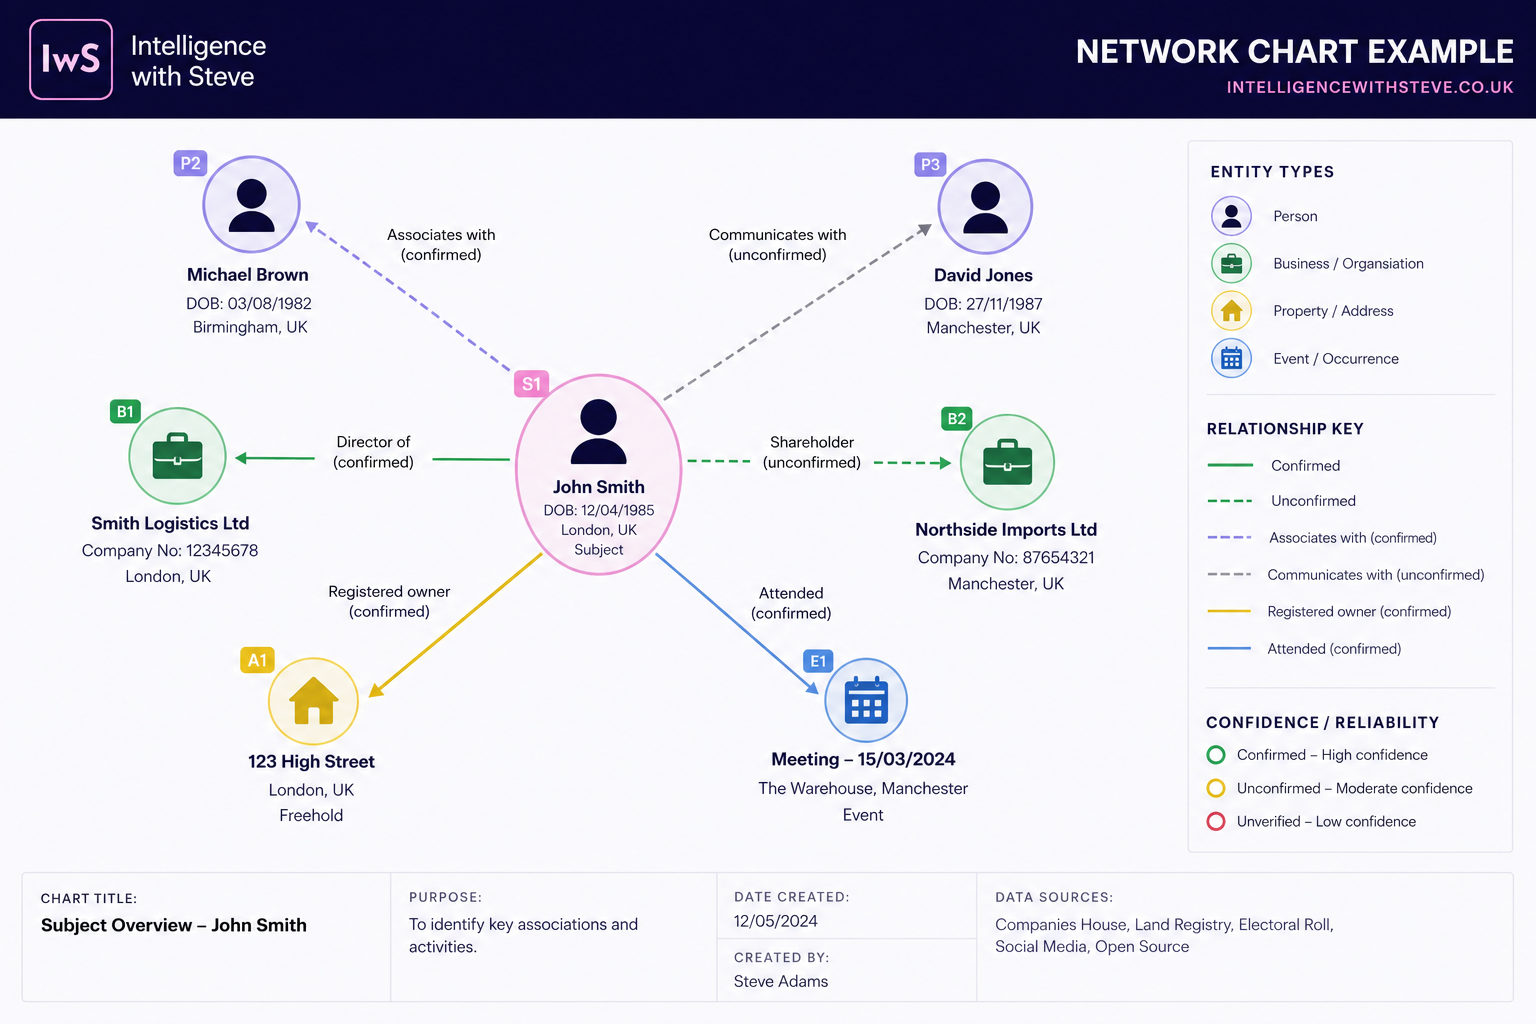
Depending on the investigation, nodes may represent:
- Individuals
- Companies
- Addresses
- Properties
- Vehicles
- Telephone numbers
- Email addresses
- Social media accounts
- Financial accounts
Links represent the relationship between those entities, for example:
- Director of
- Lives at
- Owns
- Uses
- Employs
- Family member
- Phone contact
- Business partner
- Witnessed
Rather than simply listing these relationships, a network chart allows analysts to identify clusters, central figures, intermediaries and hidden associations within a wider network.
Why network charts matter
Humans are naturally good at recognising visual patterns. As investigations grow, keeping relationships in your head or inside spreadsheets quickly becomes challenging.
Network charts are a method of identifying criminal associations between people, organisations and objects, helping analysts identify hierarchies, intelligence gaps and intervention opportunities. A network chart allows investigators to:
- identify key individuals
- understand organisational structures
- discover relationships
- identify communication pathways
- reveal facilitators rather than only offenders
- identify opportunities for disruption
- highlight intelligence gaps
- brief investigators quickly
Building a network chart from OSINT
OSINT investigations into networks of individuals and businesses can generate enormous amounts of relationship data. This may include information from company registers, electoral rolls, land ownership records, court cases, social media, news articles and many other public sources. Network charts allow investigators to visualise these relationships in a way that is difficult to achieve through text alone.
In some investigations, the objective is to map an entire network to identify key players, organisational structures and hidden associations. In others, the chart is centred on a single subject, with surrounding nodes used to present all of the people, organisations, properties and other entities connected to that individual. Both approaches help investigators understand complex relationships and communicate findings more effectively.
Network analysis goes beyond drawing lines
Creating a chart is not intelligence analysis in itself. The value comes from interpreting what the chart shows. Analysts ask questions such as:
- Who appears to control the network?
- Who connects otherwise separate groups?
- Which individuals appear most influential?
- Which entities have the greatest number of relationships?
- Are there hidden clusters?
- Are there isolated individuals?
- Which relationships require corroboration?
- Where are the intelligence gaps?
This process transforms information into intelligence.
The chart supports the analysis; it does not replace it.
Following charting standards
One mistake some investigators make is producing diagrams that only they can understand. Intelligence teams typically adopt standard charting conventions so every analyst produces charts in a consistent format.A corporate charting style should dictate consistent icons, attributes, links and legends to improve interpretation and sharing between teams. Although standards vary between organisations, most include the following principles.
Use consistent entity symbols
A consistent visual language makes large charts far easier to understand, so every entity type should have its own symbol or icon.
For example:
Clearly define relationships
Links should describe the relationship rather than simply joining two nodes. Examples include:
- Director of
- Lives at
- Owns
- Former director
- Family member
- Employee
- Uses phone
- Controls
- Shared address
Relationship labels should be concise and unambiguous.
Distinguish confirmed and unconfirmed links
Not every relationship carries the same level of confidence. Many intelligence units distinguish:
- Confirmed relationships
- Probable relationships
- Possible relationships
- Intelligence-led assumptions
These may be represented through different:
- line styles
- colours
- confidence indicators
Avoid presenting assumptions as facts.
Record the evidence behind every link
A chart should never become detached from its evidence. Each node and relationship should link back to supporting material such as:
- Companies House filings
- Electoral roll entries
- Court documents
- Intelligence reports
- Social media captures
- News articles
- Witness statements
This allows investigators to validate every relationship and maintain an evidential audit trail.
Include attributes
Nodes should contain more than a name. Useful attributes include:
- date of birth
- aliases
- occupation
- risk level
- nationality
- company number
- incorporation date
- status
- address
- ownership
- land registry title
The more metadata available behind each node, the more useful the chart becomes during an investigation.
Avoid clutter
Large investigations can produce hundreds or thousands of nodes. Good analysts focus each chart around a single investigative question. Ask yourself: What story is this chart trying to tell?
Common mistakes
Poor network charts often suffer from the same problems:
- too many crossing lines
- inconsistent icons
- missing relationship labels
- duplicated entities
- no indication of evidence strength
- no legend
- relationships without supporting evidence
- excessive colours
- attempting to show the entire investigation on one chart
A clear chart containing fifty well-evidenced relationships is usually more valuable than a confusing chart containing five hundred.
Software for network charting
Network charts can be created using dedicated link analysis software or general diagramming tools.
Popular options include:
The best choice depends on whether you require manual charting, automated relationship discovery or integration with investigative datasets.
Building a Network Chart
A network chart is much more than a visual diagram. It is an intelligence product that helps investigators understand relationships, identify hierarchy, expose hidden associations and communicate complex findings quickly to decision-makers.
When supported by high-quality OSINT, structured analytical techniques and consistent charting standards, network charts become one of the most powerful tools available to intelligence professionals. They enable analysts to move beyond collecting information and towards explaining how people, organisations and events fit together, allowing operational teams to prioritise subjects, identify disruption opportunities and make better-informed decisions.
Ready to move from individual guides to a complete methodology?
Compare practitioner-led training in OSINT Tradecraft, Intelligence Methodology and the complete OSINT Practitioner Programme.
Explore professional trainingGet new handbook chapters as they go live.
Join the Intelligence with Steve community for new guides, member-only articles and training updates.
Join free